Browser Access
Planned
- Make graphs appear like "Live Microburst Analysis" lower down on Cases page.
- Separate graphs per conversation.
- interactive zoom (like Splunk).
- Lose the table (make it downloadable CSV) and show information by hovering over the graph.
- Do a PDF exported report style document including the graphing and tables
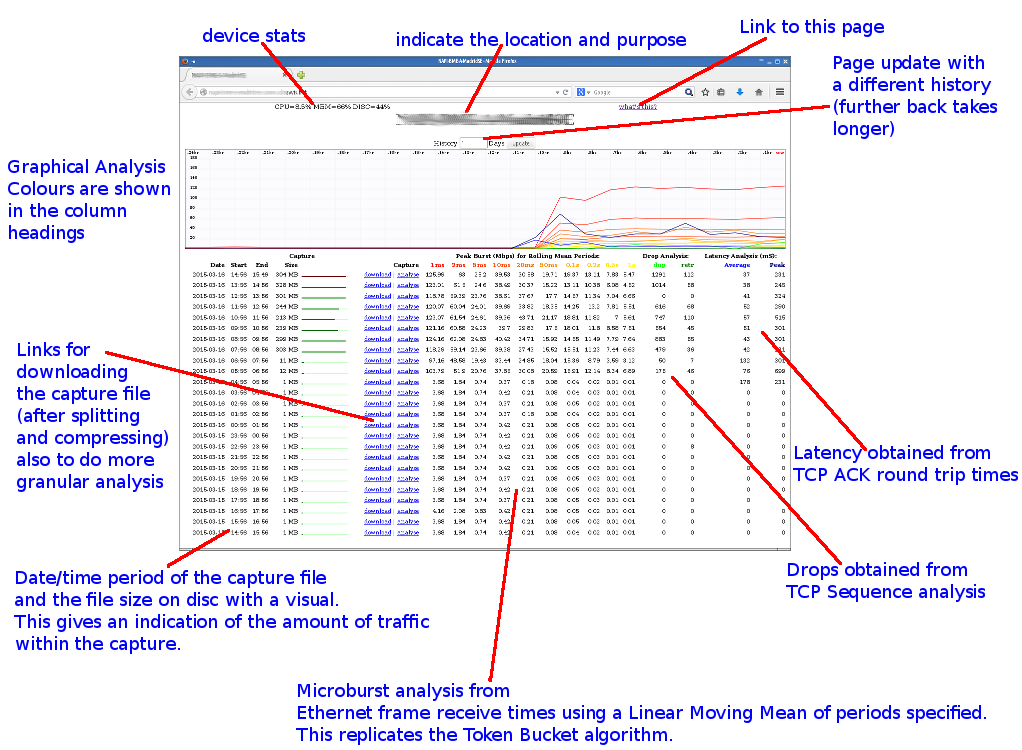
Historical Analysis
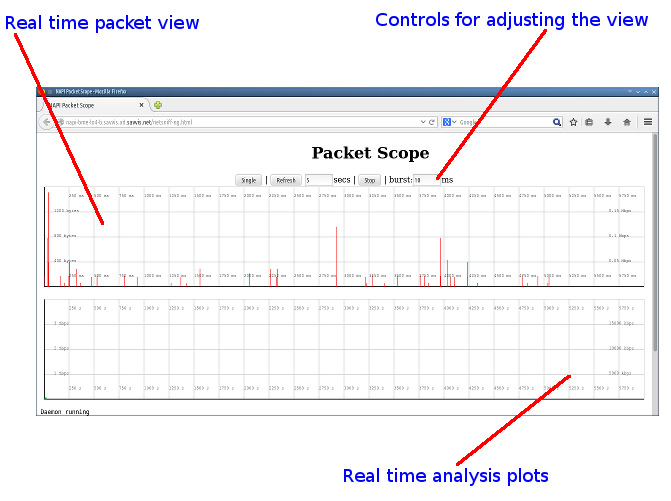
Realtime Analysis